How I Made: Phase 90 Clone with a 555-Timer LFO
Design Overview
A phaser splits the guitar signal into a dry path and a wet path, shifts the phase of the wet path with a chain of all-pass filters, and adds the two back together. Wherever the wet signal ends up 180° out of phase with the dry signal, the two cancel and leave a notch in the frequency response. A low-frequency oscillator (LFO) sweeps the all-pass filters up and down, so the notches move and produce the swirling sound the effect is known for.
Reference Design
My reference is the “Phase 45 like clone” published by Barbarach [1], shown in Fig. 1. The author describes it as a cross between the MXR Phase 45 and Phase 90: it uses the Phase 90’s input, LFO, and mixer sections with the Phase 45’s two phase-shifting stages. It runs on a single 9 V supply. A 5.1 V zener reference (R20, D1, and C7) sets the DC level that every stage is centered on. An input buffer (U1B) feeds two JFET all-pass stages (U2A and U2B with Q1 and Q2), and a PNP mixer (Q3) sums the shifted signal with the dry buffer output through R10 and R11. One section of a TL072 (U1A) generates the LFO, a reverse-log pot (RV1) sets its speed, and a trimpot (RV2) sets the DC bias on the JFET gates.
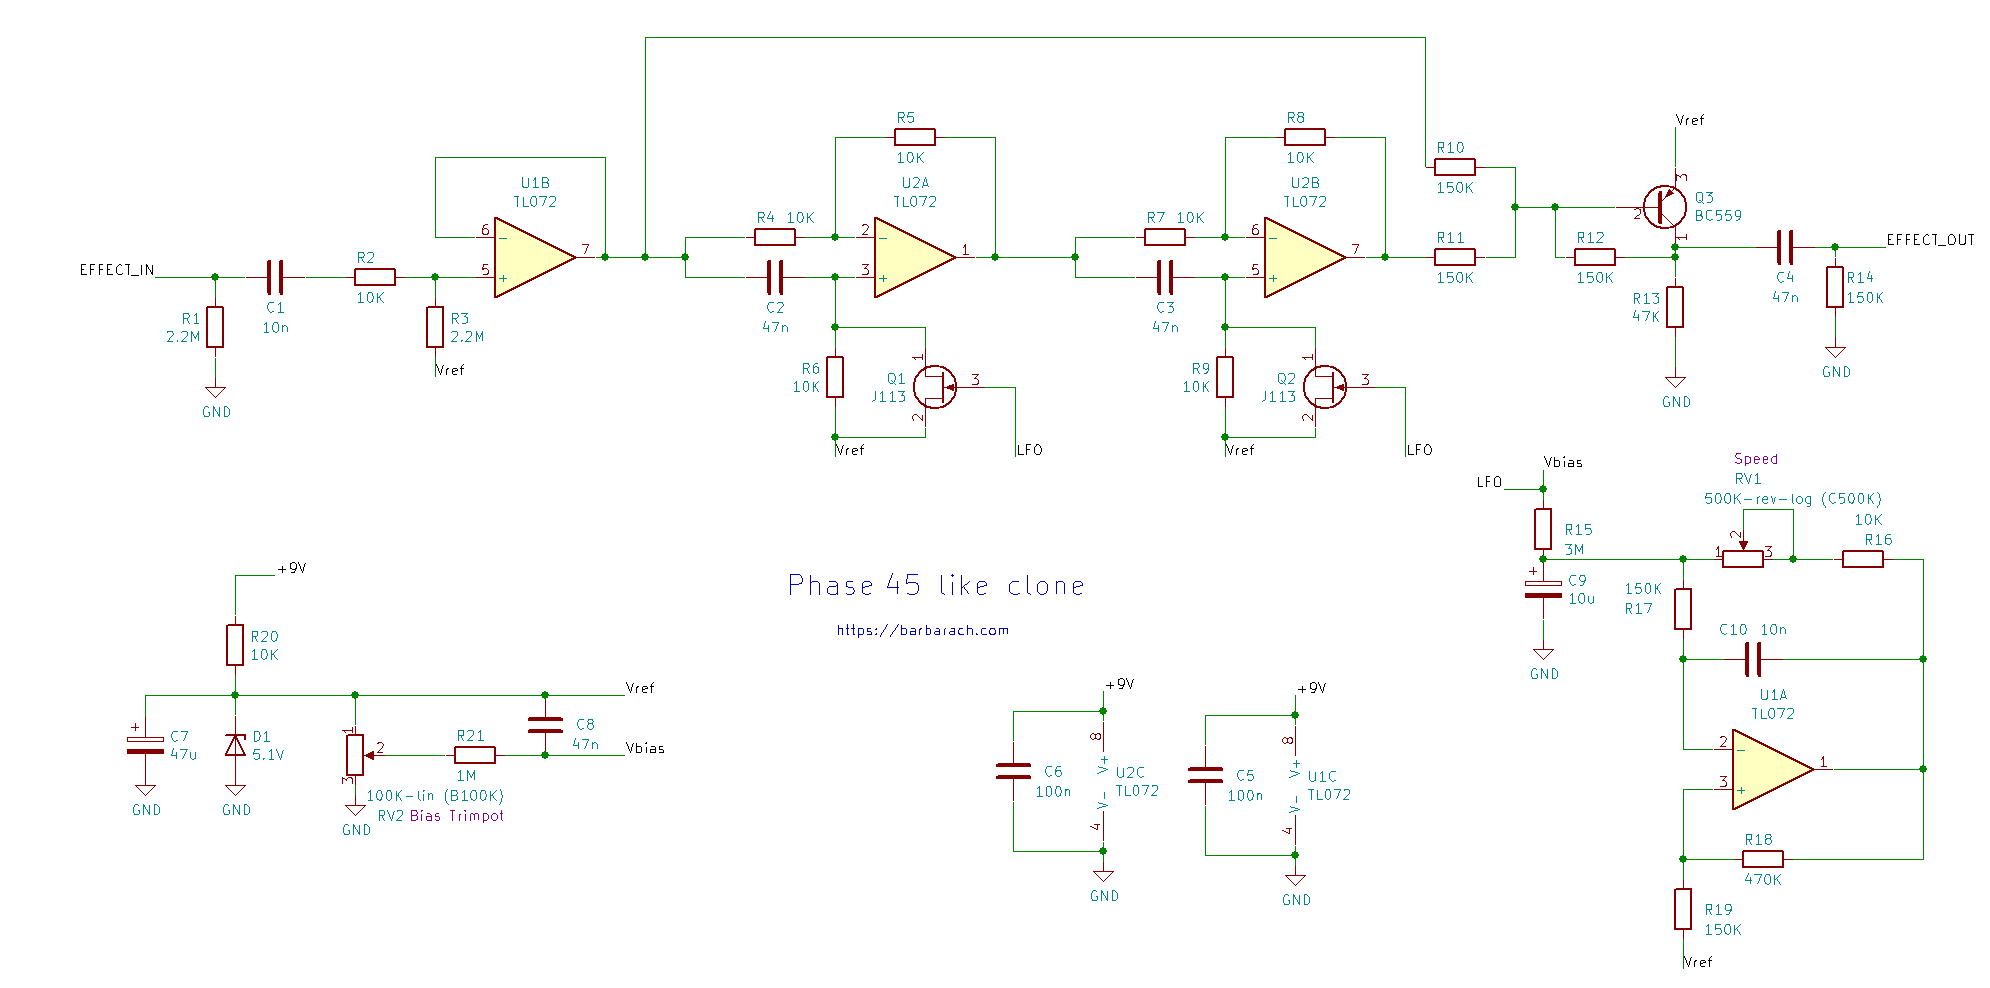
Two all-pass stages give the Phase 45 one notch. The Phase 90 uses four stages and gets two notches, which makes the sweep deeper and more obvious [2].
Modifications
I made six main changes to the reference design. Fig. 2 shows how the final design fits together.
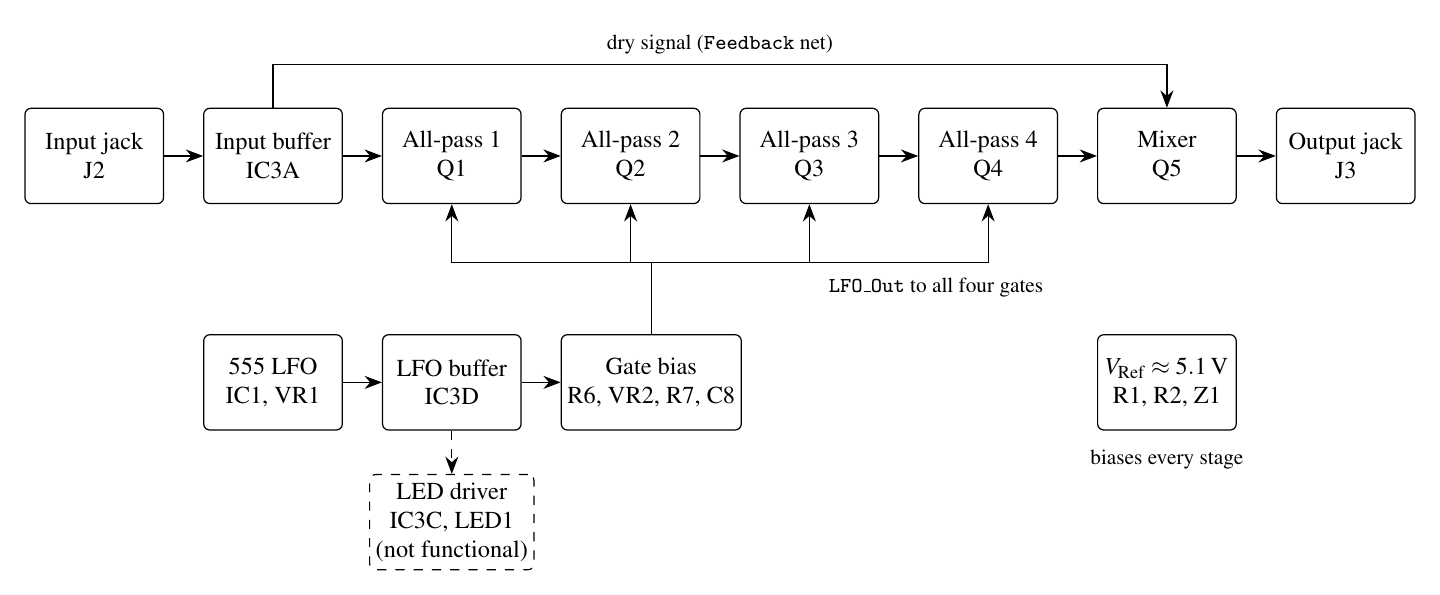
First, I replaced the op-amp LFO with a 555 timer in astable mode, which is the core requirement of this project. The 555 Timer Configuration section covers how it works.
Second, I doubled the all-pass chain from two stages to four. That turns the Phase 45 style circuit into a Phase 90 style circuit with two notches.
Third, the 555’s capacitor voltage does not sit in the right range for the JFET gates on its own, so I added a buffer and a bias network (R6, C8, R7, and VR2) between the 555 and the gates.
Fourth, I swapped the TL072s for two LM324 quad op-amps. IC2 holds all four all-pass stages. IC3 holds the input buffer, the LFO buffer, and the LED driver.
Fifth, I used 27 nF all-pass capacitors instead of 47 nF. For the same JFET resistance, that moves every notch up by a factor of 47/27 ≈ 1.74.
Finally, I added the hardware needed for a usable pedal: a speed LED meant to pulse with the LFO, a 3PDT true-bypass footswitch, a 2.1 mm DC jack, and DC-blocking capacitors on both 1/4 in jacks.
Design Evolution
The design changed several times in simulation before I committed to a PCB. My first version powered the 555 from the 5.1 V reference. The timing capacitor then swung from about 1.6 V to 3.4 V, which put the JFET gate-source voltage VGS between −3.4 V and −1.6 V. The JFETs never got close to VGS = 0, so they never conducted hard, and the phase barely moved. The OP07 I used to buffer the capacitor also clipped near 1 V, because a 5.1 V supply sits below the OP07’s minimum supply voltage.
Moving the 555 and its buffer to the 9 V rail fixed both problems and widened the capacitor swing to 3 V to 6 V. That created a new problem. The top of the swing now sat above the 5.1 V source voltage on the JFETs, which would forward-bias the gate-source junction and push LFO current into the audio path. The bias network in the final design scales the swing down and lets me place it relative to the JFETs’ actual pinch-off voltage, which varies a lot from part to part.
555 Timer Configuration
IC1 runs in astable mode (Fig. 3). The timing capacitor C4 (2.2 µF) charges through RA and RB until it reaches ⅔VCC. The upper comparator then turns on the discharge transistor, which pulls the RA/RB junction to ground, and C4 discharges through RB alone until it falls to ⅓VCC. The lower comparator then releases the discharge pin, and the cycle repeats [3]. The frequency is
f = 1.44 / ((RA + 2RB) C) (1)
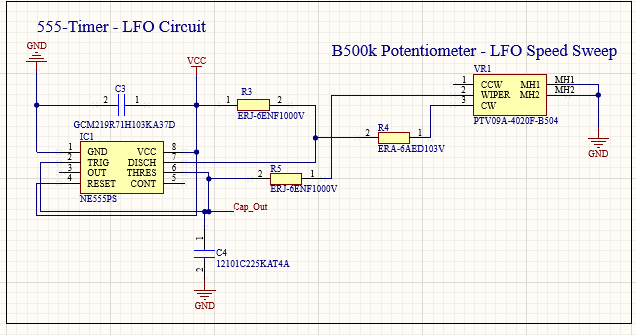
Most 555 designs use the square wave on pin 3. I use the capacitor voltage itself as the LFO instead. With a 9 V supply, it ramps between 3 V and 6 V. RA is only 100 Ω, so C4 charges and discharges through nearly the same resistance. The duty cycle,
D = (RA + RB) / (RA + 2RB) (2)
stays between 52.4% at RB = 1 kΩ and 50.0% at RB = 500 kΩ. The rising and falling ramps take almost the same time, so the waveform is close to a symmetric triangle. Each ramp is an exponential segment, so its slope drops by half from the start of the ramp to the end, but the shape has no steps or edges for the JFETs to follow.
On the board, R3 (100 Ω) is RA, the speed network (VR1, R4, and R5) sets RB, and C3 (10 nF) decouples the 555’s supply. Using the simulation’s RB range of 1 kΩ to 500 kΩ, equation (1) gives 311.68 Hz at the fastest setting and 0.65 Hz at the slowest.
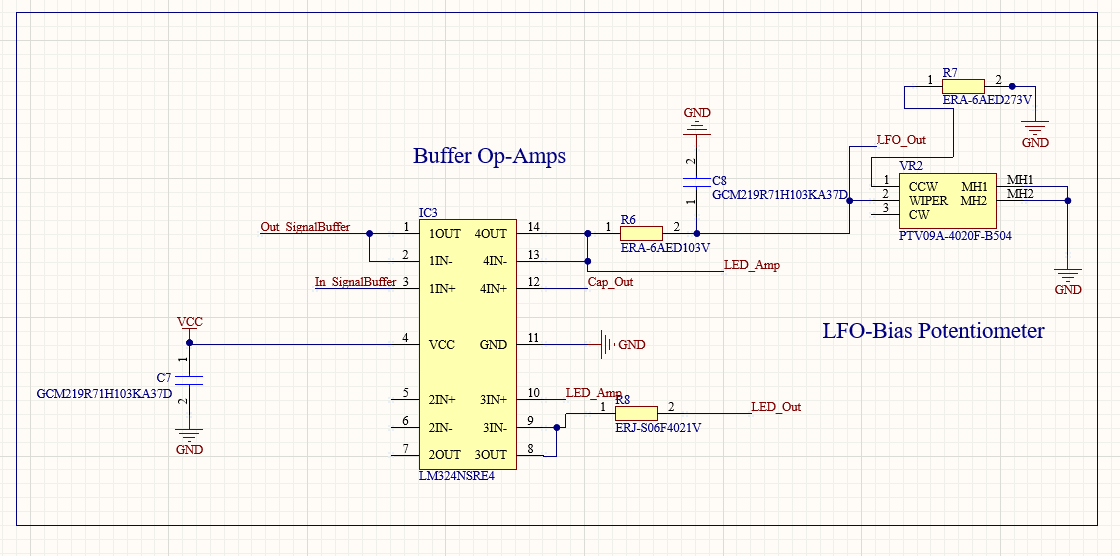
IC3’s fourth section buffers the capacitor voltage (Cap_Out) as a unity-gain follower (Fig. 4). Without it, the gate network would load C4 and change both the frequency and the thresholds.
Gate Drive and Bias
The buffered LFO passes through R6 (10 kΩ) onto the gate net, LFO_Out, which drives all four JFET gates. VR2 (500 kΩ) in series with R7 (27 kΩ) forms the lower leg of a divider with R6, and C8 (10 nF) filters the gate line. The gate voltage is
VG = VC · Rx / (R6 + Rx), Rx = R7 + RVR2 (3)
With VR2 at zero, the 3 V to 6 V capacitor swing maps to 2.19 V to 4.38 V at the gates, so VGS sweeps from −2.91 V to −0.72 V. That covers the J113’s specified pinch-off range of −0.5 V to −3 V [5]. Turning VR2 up moves the whole sweep higher and makes it slightly larger, up to 2.94 Vpp. Past about RVR2 = 30 kΩ, the top of the sweep crosses the 5.1 V reference, so the useful bias range sits in the first part of VR2’s rotation.
All-Pass Stages
Each phase stage is a first-order all-pass filter (Fig. 5 and Fig. 6). The stage input drives the inverting input through a 10 kΩ resistor and the non-inverting input through a 27 nF capacitor. The non-inverting input returns to VRef through a 10 kΩ resistor in parallel with a J113, and an equal 10 kΩ resistor closes the feedback loop. For stage one, these are R12, C9, R13, Q1, and R14. The transfer function is
H(s) = (sRC − 1) / (sRC + 1), R = R13 ∥ rDS (4)
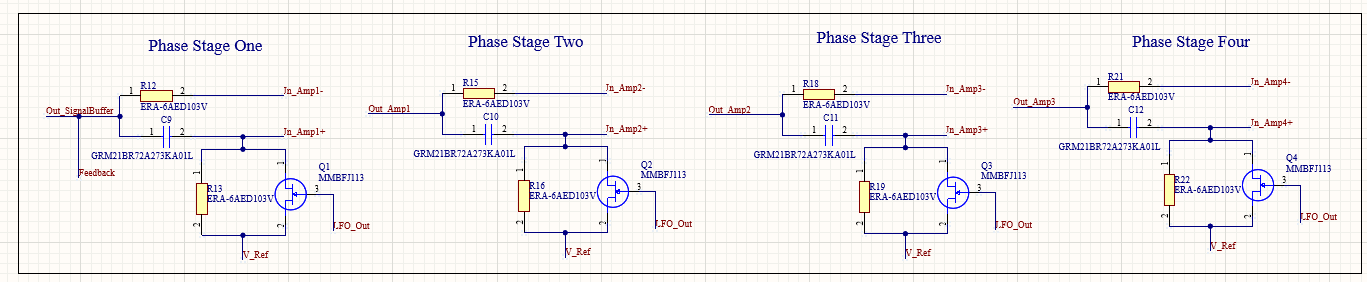
The magnitude of (4) is 1 at every frequency, so the stage passes the whole signal at constant amplitude and only shifts its phase:
φ(f) = 180° − 2 arctan(f / fc), fc = 1 / (2πRC) (5)
Each stage goes from 180° at low frequency to 0° at high frequency and passes 90° at fc. The JFET acts as a voltage-controlled resistor. With the JFET pinched off, R = 10 kΩ and fc = 589 Hz. As the gate voltage rises, rDS falls toward the J113’s on-resistance of at most 100 Ω [5], and fc rises toward 59.5 kHz.
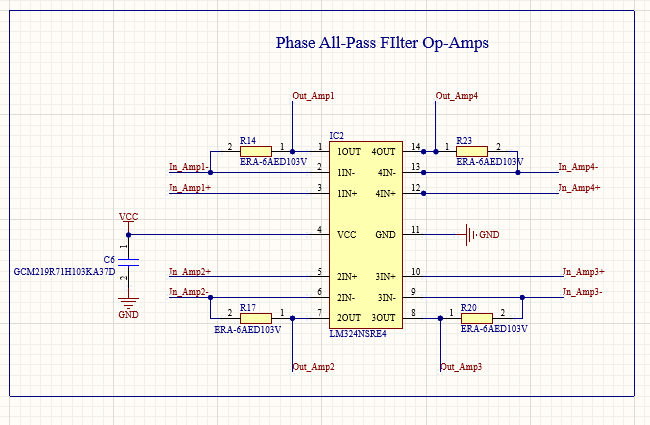
Mixer and Notch Positions
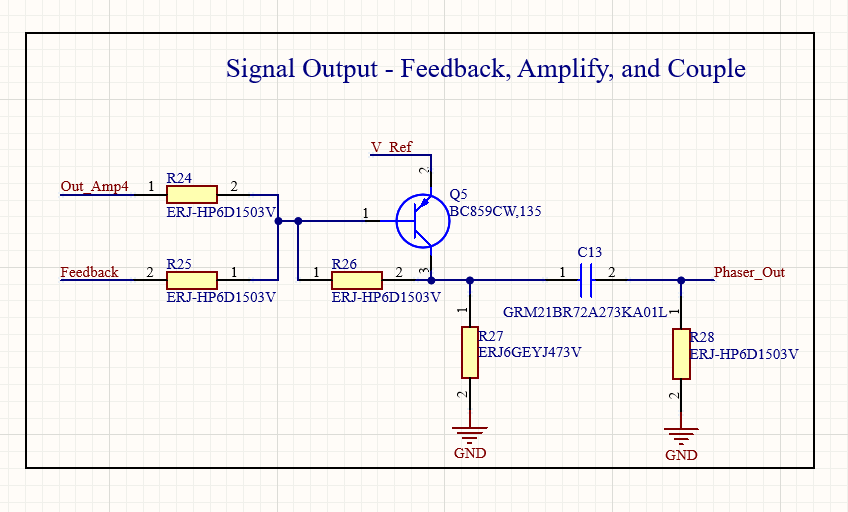
The four stages in series give a total phase of 720° − 8 arctan(f / fc). The mixer, Q5, sums this wet signal (Out_Amp4, through R24) with the dry buffer output (the Feedback net, through R25), as shown in Fig. 7. Q5 is a common-emitter PNP stage with R26 as shunt feedback, so it inverts both paths by the same amount and keeps their relative phase. Notches form wherever the wet path sits 180° from the dry path. For four stages, that happens at total phases of 540° and 180°:
fn1 = fc tan(22.5°) = 0.414 fc, fn2 = fc tan(67.5°) = 2.414 fc (6)
With the JFETs off, the notches sit at 244 Hz and 1.42 kHz, and both climb as the LFO turns the JFETs on. For comparison, the reference design’s 47 nF capacitors put the same two notches at 140 Hz and 818 Hz. C13 (27 nF) and R28 (150 kΩ) couple the mixer output to the footswitch with a high-pass corner of 39 Hz, which is below the 82 Hz low E string.
Supporting Circuitry
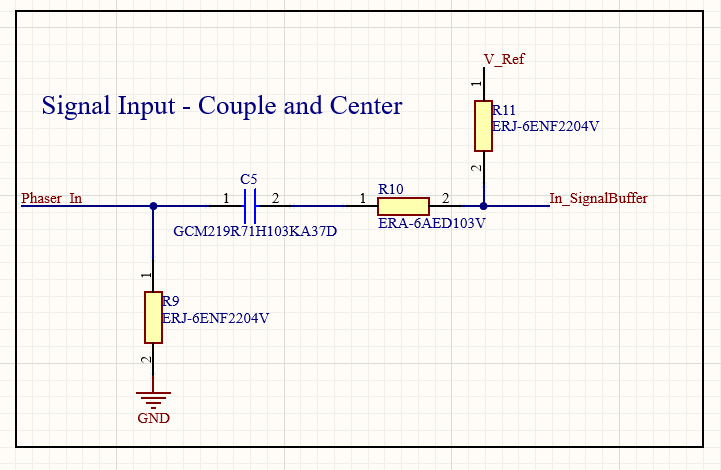
R9 (2.2 MΩ) holds the effect input at ground while the pedal is bypassed, so switching it on does not pop. C5 (10 nF) couples the signal in, and R11 (2.2 MΩ) re-centers it on VRef with a 7.2 Hz high-pass corner (Fig. 8). R10 (10 kΩ) feeds the input buffer, IC3’s first section.
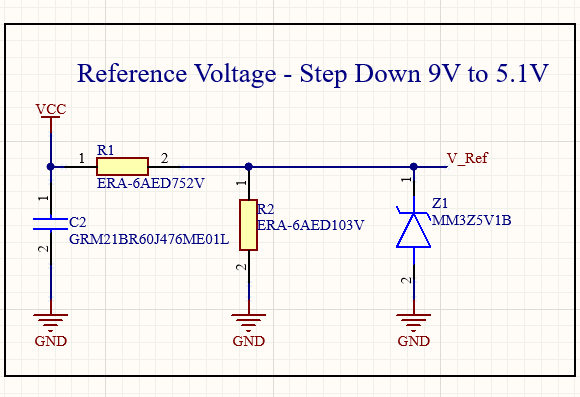
VRef comes from R1 (7.5 kΩ), R2 (10 kΩ), and Z1, a 5.1 V zener (Fig. 9). The divider alone sets 5.14 V, so Z1 carries very little current and mainly clamps the node.
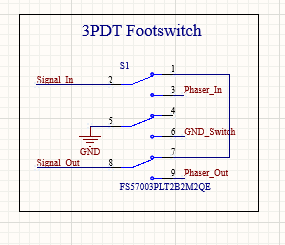
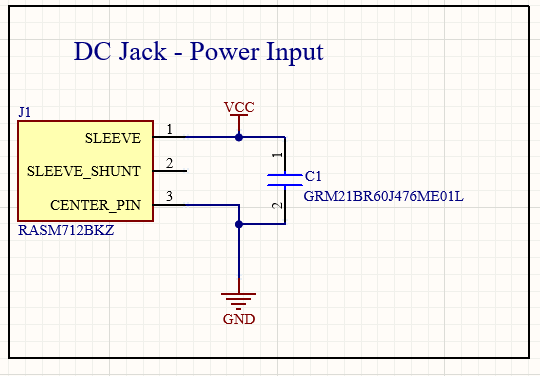
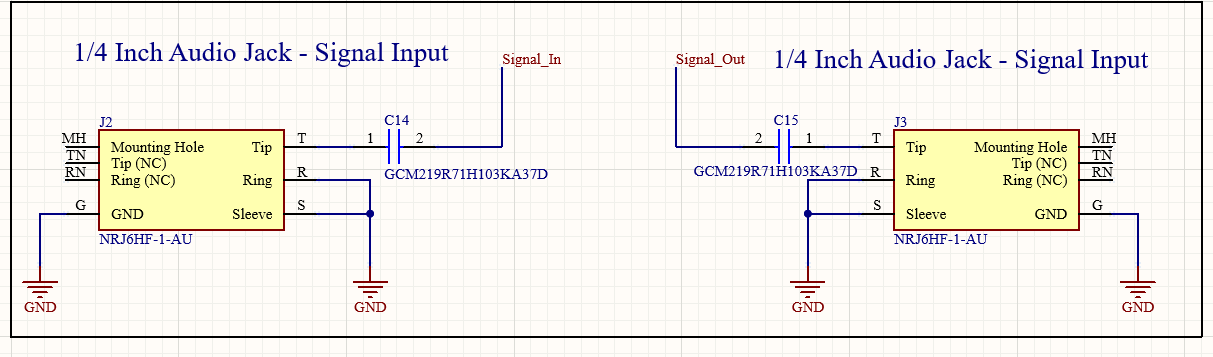
S1 is a 3PDT footswitch wired for true bypass (Fig. 10). In bypass, the input jack connects straight to the output jack. When the pedal is on, two poles route the signal through the effect and the third pole grounds the LED’s cathode. J1 is a 2.1 mm center-negative DC jack, the standard for guitar pedals, with C1 (47 µF) for bulk filtering (Fig. 11). C14 and C15 (10 nF) block DC at the input and output jacks (Fig. 12).
LED1 was meant to show the LFO speed (Fig. 13). IC3’s third section was supposed to buffer the LFO voltage and drive the LED through R8 (4.02 kΩ), so the LED current would swing from about 0.25 mA to 1 mA and its brightness would pulse with the sweep. The LED Buffer Pin Error section covers why it does not work on the board. Table 1 summarizes the role of every part.
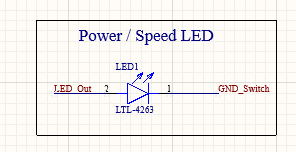
Table 1. Component and functionality breakdown.
| Component | Function |
|---|---|
| J1, C1, C2 | 9 V DC input (center negative) and 47 µF bulk filtering |
| R1, R2, Z1 | 5.1 V reference that centers every stage |
| J2, J3, C14, C15 | 1/4 in input and output jacks with DC-blocking capacitors |
| S1 | 3PDT true bypass; also switches the LED’s ground |
| R9, C5, R10, R11 | Input pulldown, coupling, and re-centering on VRef |
| IC3 (section 1) | Unity-gain input buffer |
| IC2, R12 to R23, C9 to C12 | Four first-order all-pass stages |
| Q1 to Q4 | J113 JFETs used as voltage-controlled resistors |
| Q5, R24 to R28, C13 | Dry and wet mixer, output coupling, and pulldown |
| IC1, R3 to R5, VR1, C3, C4 | 555 astable LFO and speed control |
| IC3 (section 4) | Buffers the 555 capacitor voltage |
| R6, C8, R7, VR2 | Gate drive filter and LFO bias |
| IC3 (section 3), R8, LED1 | Speed LED driver (not functional on the board) |
| C6, C7 | 10 nF decoupling for IC2 and IC3 |
Design Verification
I verified the design in two steps before building the PCB: LTspice simulation [6] and a breadboard prototype.
Simulation
I split the simulation into three schematics: the voltage reference (Fig. 14), the audio path (Fig. 15), and the 555 LFO (Fig. 16 and Fig. 17).
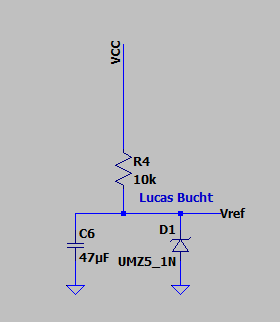
The reference schematic uses a 10 kΩ resistor, a 5.1 V zener, and a 47 µF capacitor. An operating point analysis put VRef at about 5.1 V, which is the value every other stage biases around.
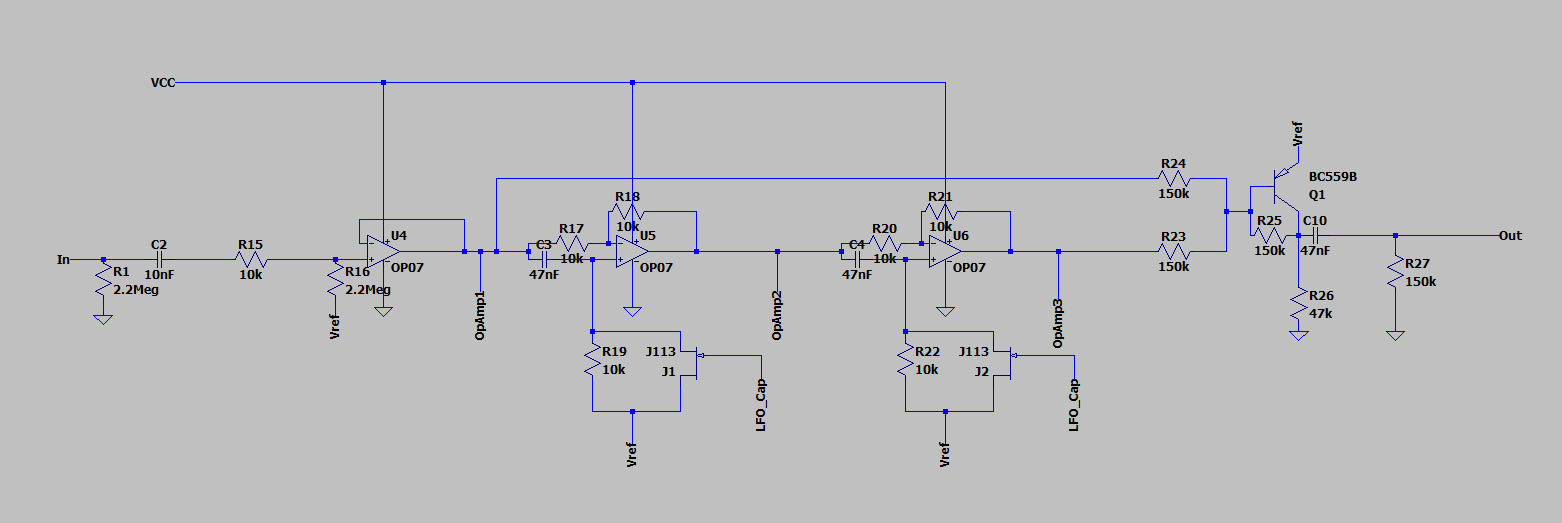
The audio path schematic models the input network, the input buffer, two of the four all-pass stages, and the PNP mixer, using OP07 op-amps and a BC559B. All four stages on the board are identical, so two stages were enough to check the all-pass behavior and the mixer. I ran transient analyses with a sine input while the simulated LFO drove the JFET gates, and probed each stage output. This is where I found the gate drive problem described in Design Evolution. To hear the result instead of just looking at it, I exported the simulated output from LTspice as text and converted it to a WAV file with a short Python script.
The LFO schematic models the 555 with an NE555 macro-model and the buffer with an OP177. LTspice has no built-in potentiometer, so instead of a pot model, I simulated the two ends of the speed control as fixed values of RB: 500 kΩ for the slowest setting (Fig. 16) and 1 kΩ for the fastest (Fig. 17). The schematic also has a 4 kΩ and 100 Ω divider (R30 and R6) after the buffer, so the probe point, LFO_Cap, reads the capacitor voltage scaled by 100/4100 = 0.0244. I ran a 10 s transient for the slow case and about 100 ms for the fast case, which captures several full periods at each extreme.
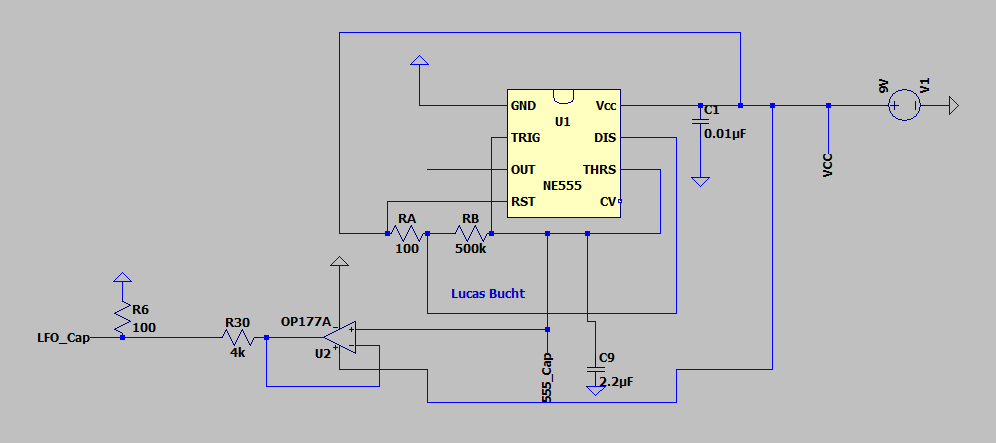
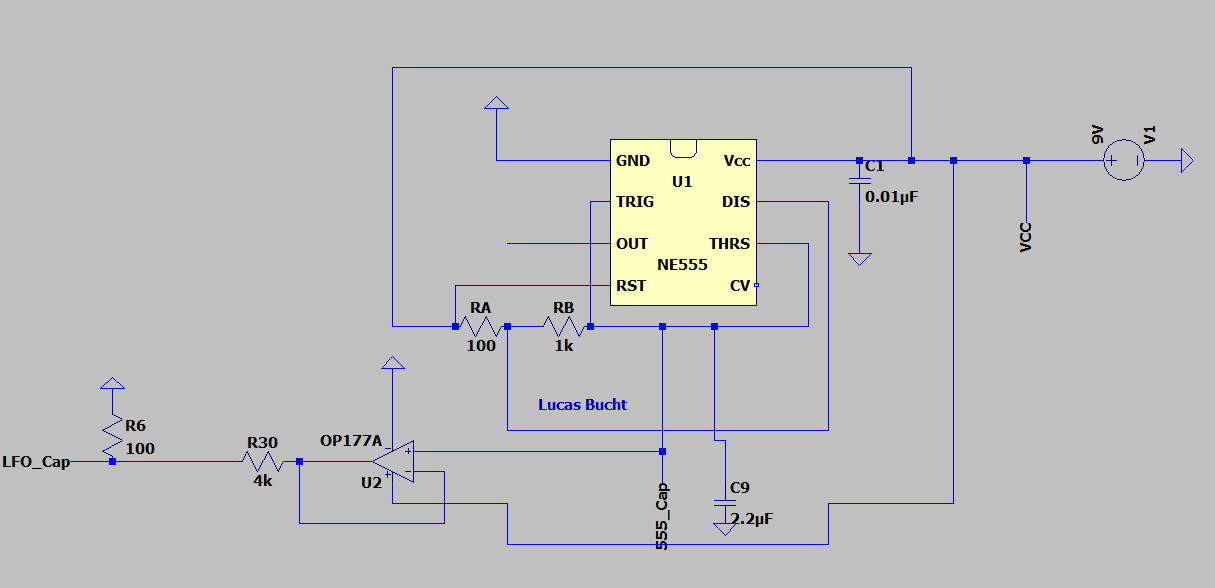
Fig. 18 and Fig. 19 show the results. In both cases, LFO_Cap ramps between 73 mV and 146 mV. Dividing by 0.0244 gives 3.0 V and 6.0 V, exactly ⅓ and ⅔ of the 9 V supply, so the 555 thresholds land where the datasheet says they should [3]. The waveform is a near-symmetric triangle with slightly curved ramps, as expected from (2).
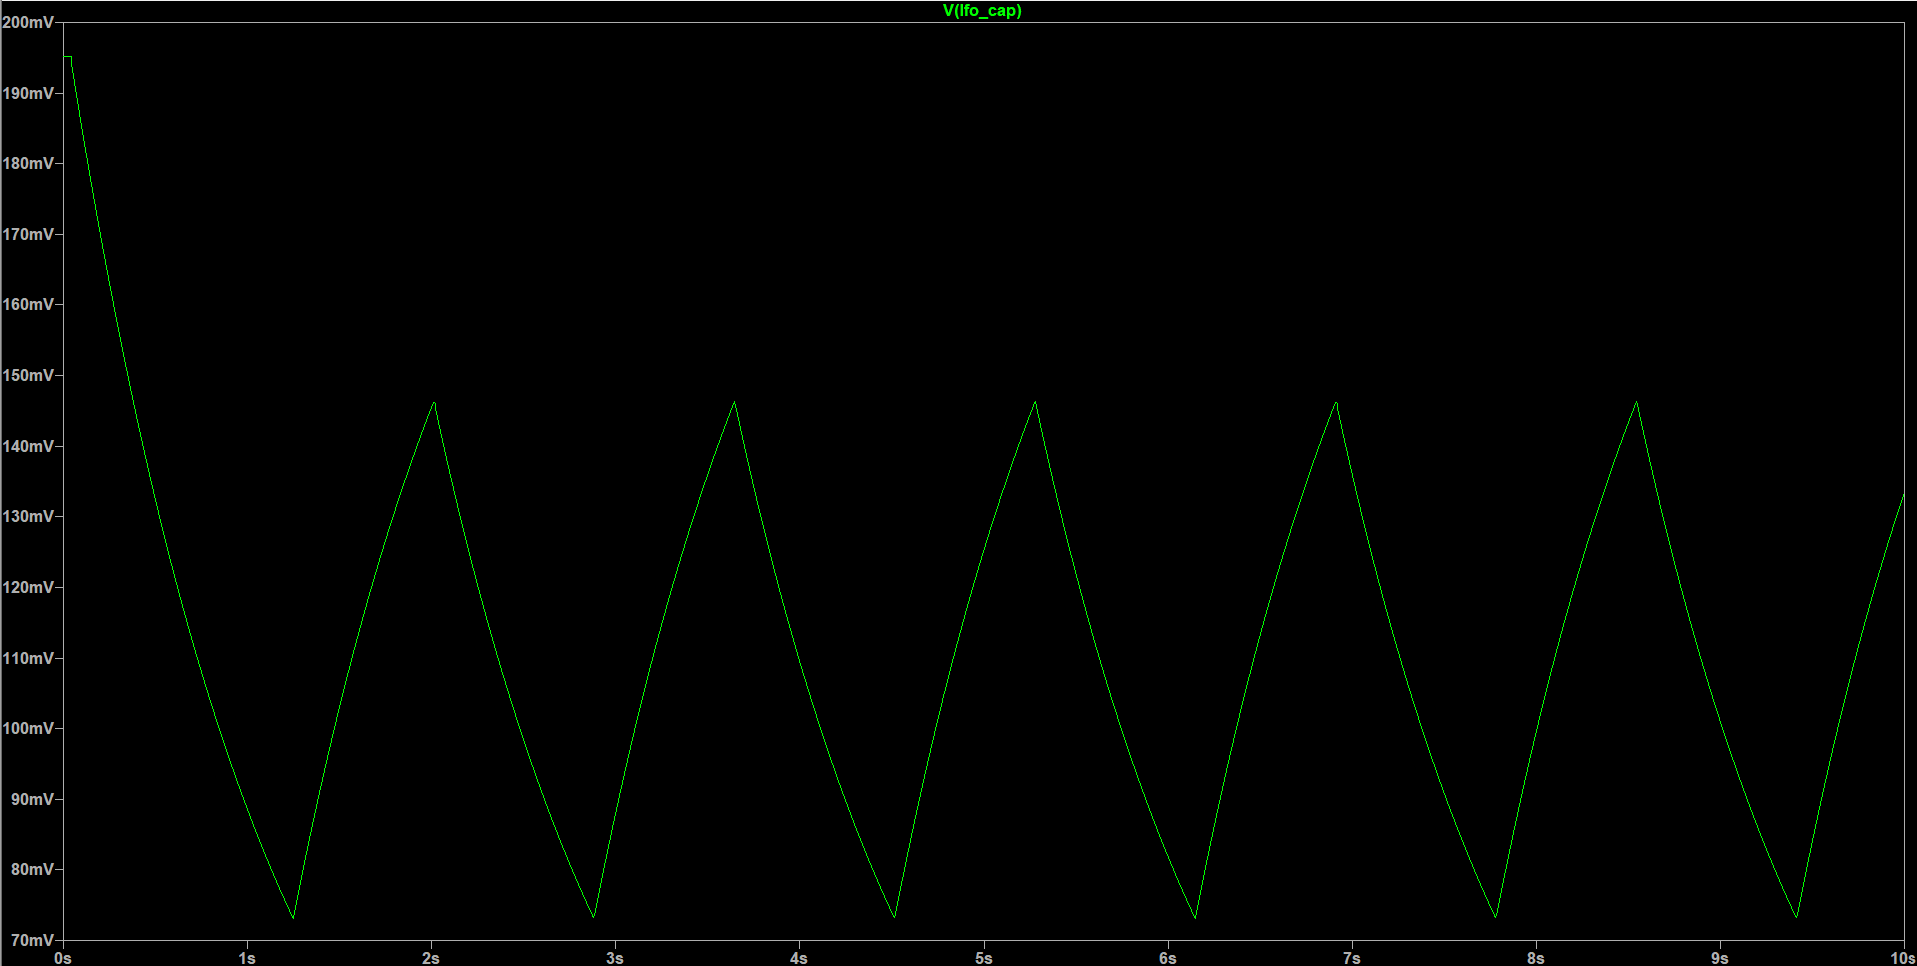
LFO_Cap at the slowest setting, 0 to 10 s. The 73 mV to 146 mV range corresponds to 3 V to 6 V on C4 after the 0.0244 probe divider.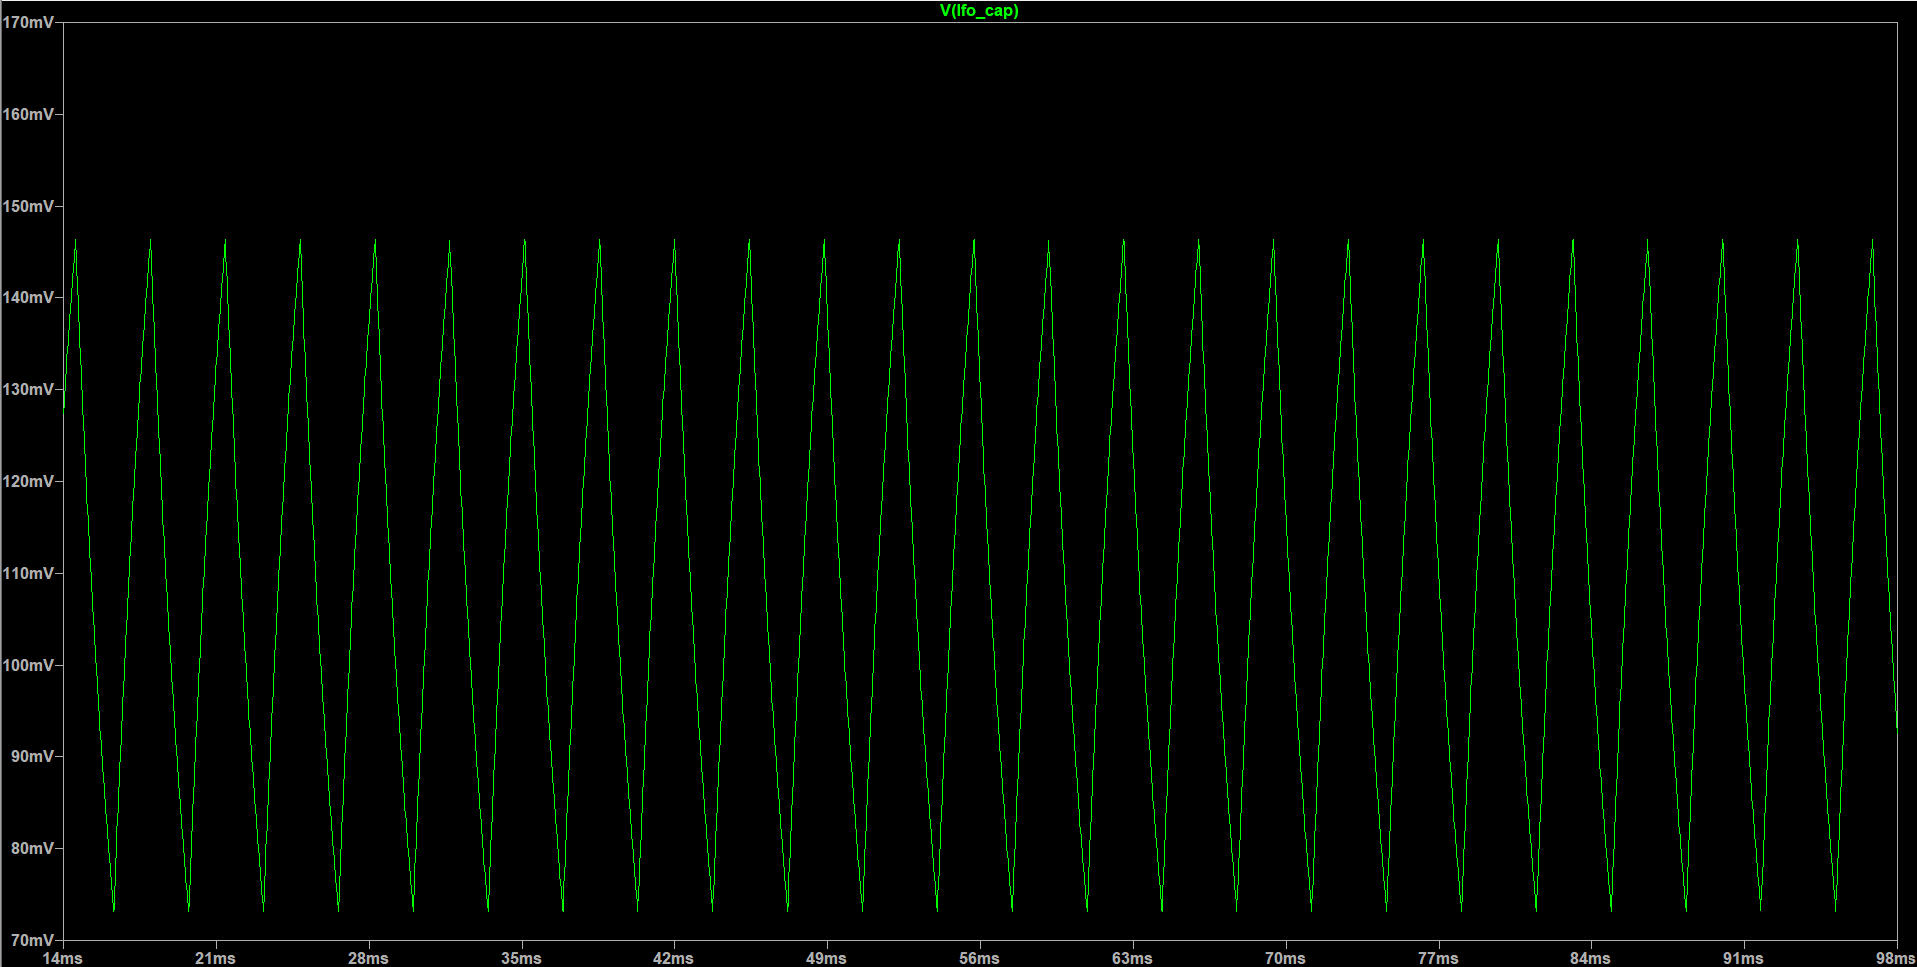
LFO_Cap at the fastest setting, 14 to 98 ms.Table 2 compares the simulated frequencies with (1). The simulation comes in about 6.5% below the hand calculation at both extremes. The 1.44 constant assumes ideal comparators and an ideal discharge switch. Since the offset is the same at both ends, it most likely comes from the NE555 model’s non-ideal behavior rather than from the timing components.
Table 2. LFO frequency, calculated vs. simulated.
| Setting | RB | Calculated (1) | Simulated | Difference |
|---|---|---|---|---|
| Slowest | 500 kΩ | 0.65 Hz | 0.6 Hz | 7.7% |
| Fastest | 1 kΩ | 311.68 Hz | 295.1 Hz | 5.3% |
My simulation test cases were: (1) VRef at its operating point, (2) the 555’s frequency and thresholds at both speed extremes, (3) the range of VGS against the J113’s pinch-off window, and (4) the phase shift through the all-pass stages as the LFO swept. Test case 3 failed on the first version of the design, which drove the changes in Design Evolution. Once all four looked right, I moved to the breadboard.
Breadboard Prototype
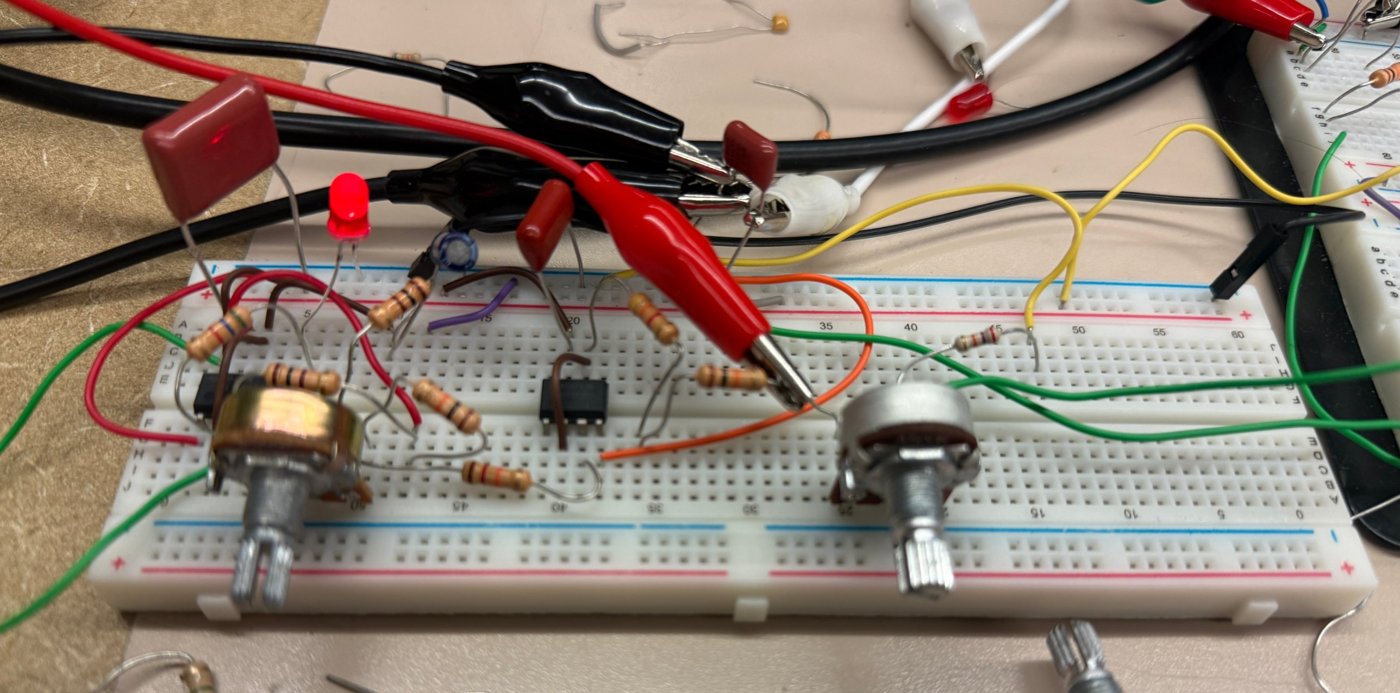
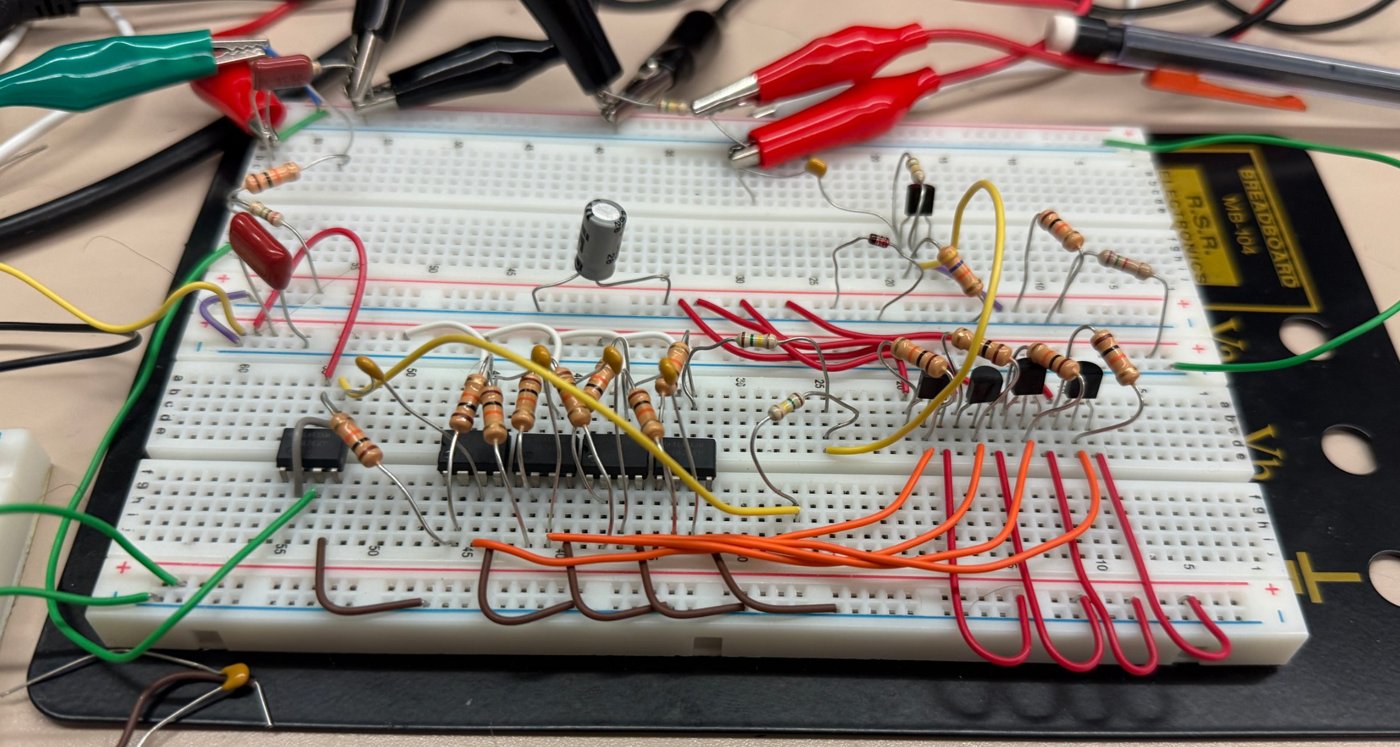
I built the prototype on two breadboards. The first (Fig. 20) holds the 555 LFO, its buffer, the speed and bias pots, and the LED, which lit on the breadboard. The second (Fig. 21) holds the reference, the input buffer, the all-pass stages with their JFETs, and the mixer.
In order to verify my breadboarded design, I probed three different parts to ensure the whole circuit was correct. The first thing I scoped was the LFO output. Having this signal displayed on one scope by itself while I probed other parts of the circuit was instrumental in making sure the timing was properly changing the output waveform. The second probe was at the signal input, where I pumped a 1\,kHz sine wave with amplitude of 100 mVpp. This input signal allowed me to make sure that the circuit wouldn’t overload the input or cause backfeeding of the signal chain. The third probe was placed at the output, where I was able to watch the phase-shifting against the input signal. Having all three signal scoped gave me a strong overview of each part of the circuit: input, timing, and output.
Design Implementation
PCB Schematic
I drew the PCB schematic in Altium as a set of functional blocks, shown in Fig. 3 through Fig. 13. Several parts exist only to turn the breadboard circuit into a usable pedal: the DC jack J1 with bulk capacitors C1 and C2, the two 1/4 in jacks J2 and J3 with DC-blocking capacitors C14 and C15, the 3PDT footswitch S1, the speed LED, and a 10 nF decoupling capacitor on each IC (C3, C6, and C7).
I used surface-mount parts for nearly everything to keep the board small. The resistors and most capacitors are 0805. C4 is a 2.2 µF, 100 V X7R capacitor in a 1210 package. The higher voltage rating keeps its capacitance stable under the 3 V to 6 V bias, which matters because C4 sets the LFO frequency. The JFETs are MMBFJ113s, the SOT-23 version of the J113 in the reference design. Q5 is a BC859CW in SOT-323, the surface-mount counterpart of the reference’s BC559. The 555 is an NE555 in an 8-pin SO package, and both LM324s are 14-pin SO parts [4]. The jacks, pots, footswitch, and LED are through-hole, which anchors the parts a player plugs into and steps on.
The schematic sheets in this write-up include the LED correction described in LED Buffer Pin Error. The fabricated board was routed from the earlier version.
PCB Layout
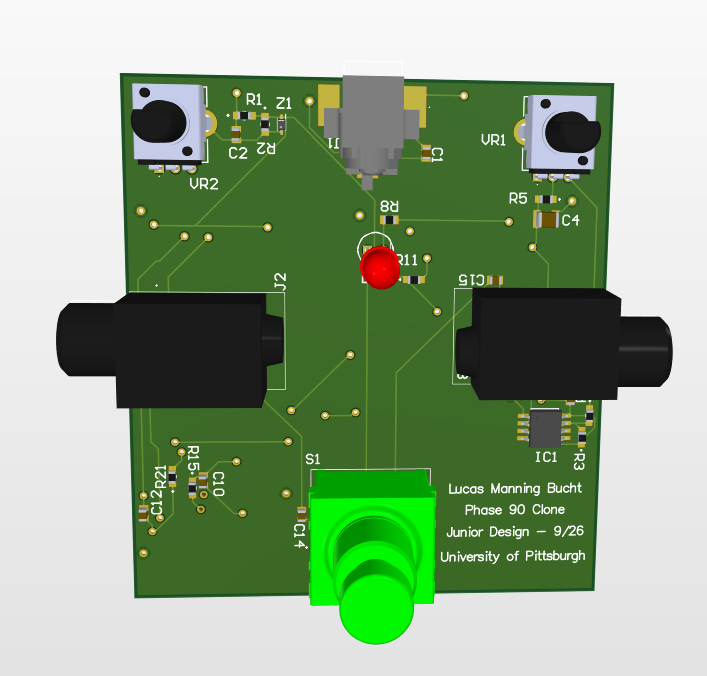
Fig. 22 shows the two-layer layout, with top copper in red and bottom copper in blue, and Fig. 23 and Fig. 24 show the 3D renders. I placed parts on both sides of the board.
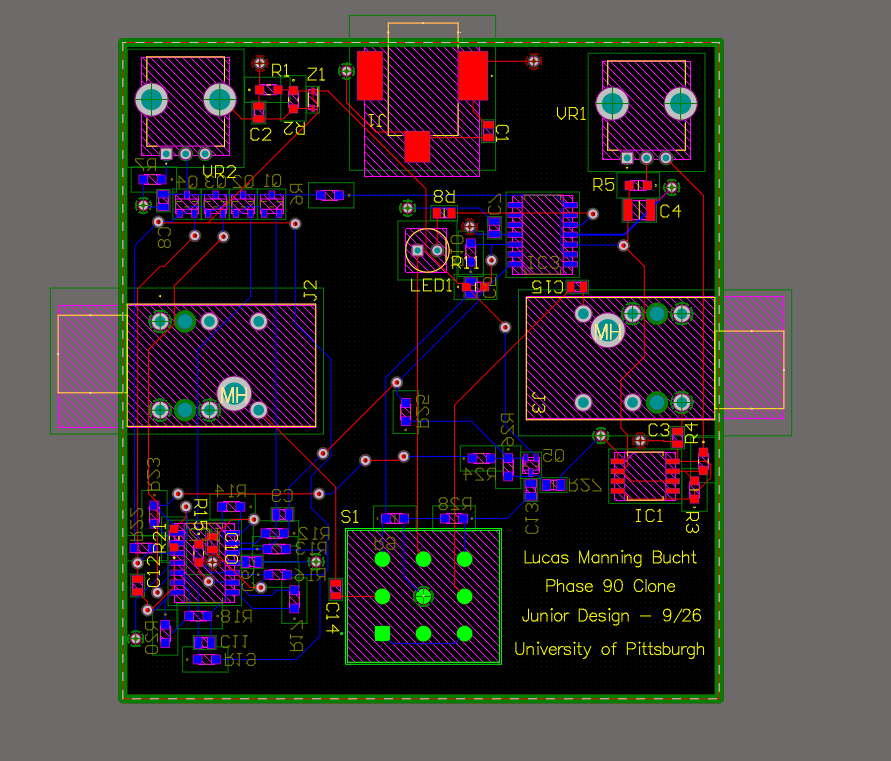
The top side holds everything the player touches or plugs into, in a standard pedal arrangement: the input and output jacks on opposite edges, the DC jack at the top center, the bias and speed pots in the top corners, the footswitch at the bottom center, and the LED in the middle. The top side also holds the reference parts next to VR2 and the 555 and its timing parts on the right side near VR1.
The bottom side holds the audio path. The twelve 10 kΩ resistors and four 27 nF capacitors of the all-pass stages are packed tightly around IC2, so each stage’s parts sit close to their op-amp pins. The four JFETs sit in a row next to R6, R7, and C8, so one short LFO_Out trace reaches all four gates. IC3, the mixer transistor Q5, and their resistors fill the rest of the bottom side.
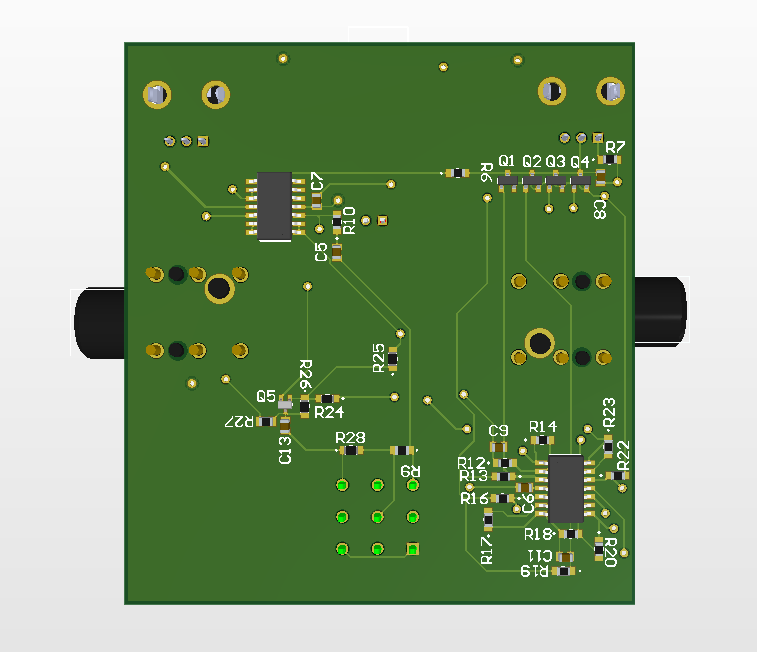
The PCB practices I followed were placing each decoupling capacitor (C3, C6, and C7) next to its IC’s supply pin, keeping each all-pass stage’s parts clustered at its op-amp, and labeling every part on the silkscreen along with a title block.
The layout matched the schematic it was routed from. The LED error was in the schematic itself at the time, so a layout-versus-schematic comparison could not catch it.
Manufacturing and Assembly
I assembled the board by hand with a soldering iron, flux, and a PCB holder, in the order shown in Fig. 25 through Fig. 28: the top-side surface-mount parts first, then the bottom-side surface-mount parts, then the through-hole jacks, pots, footswitch, and LED.
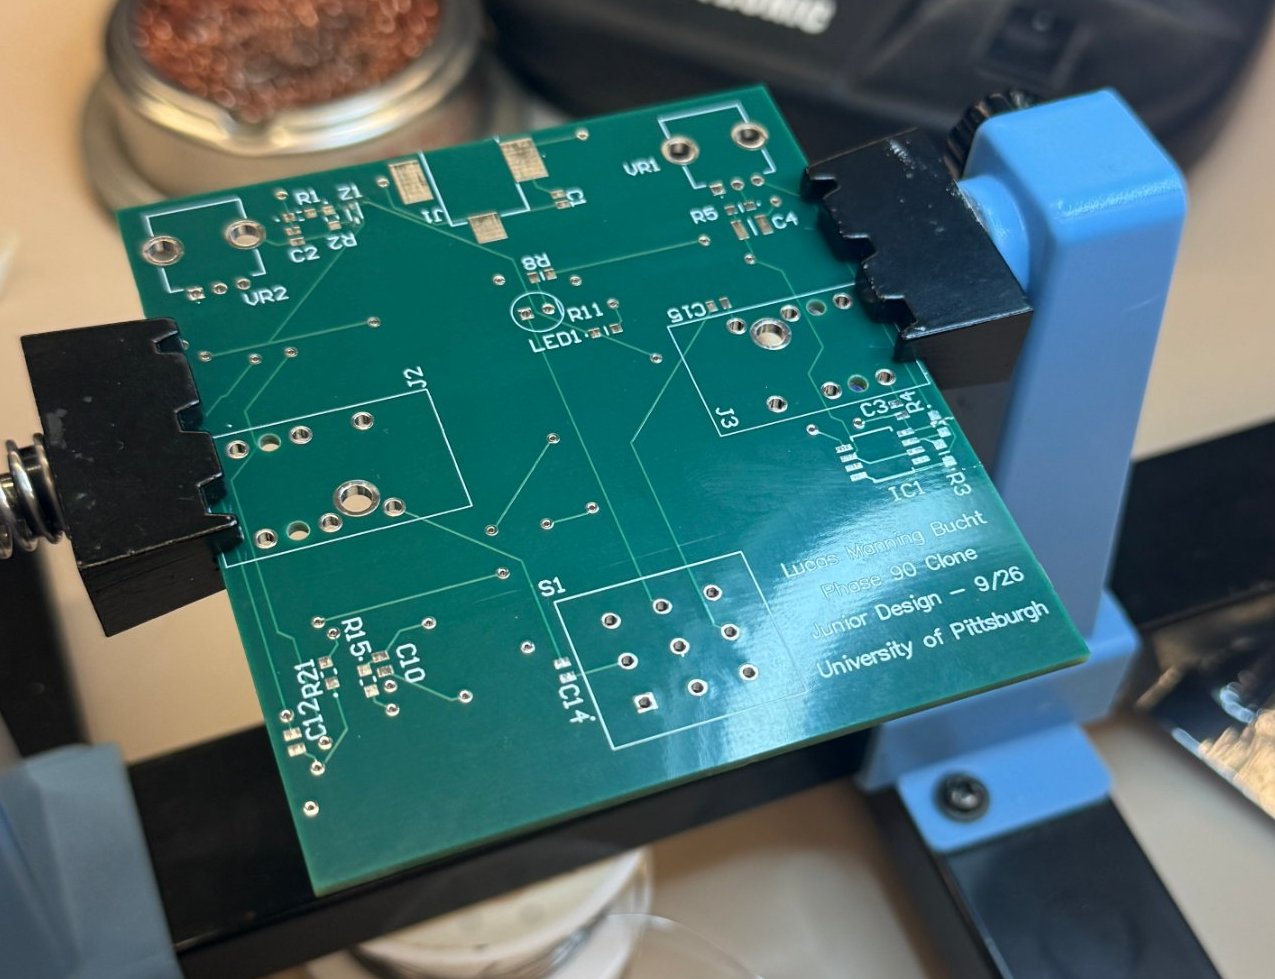
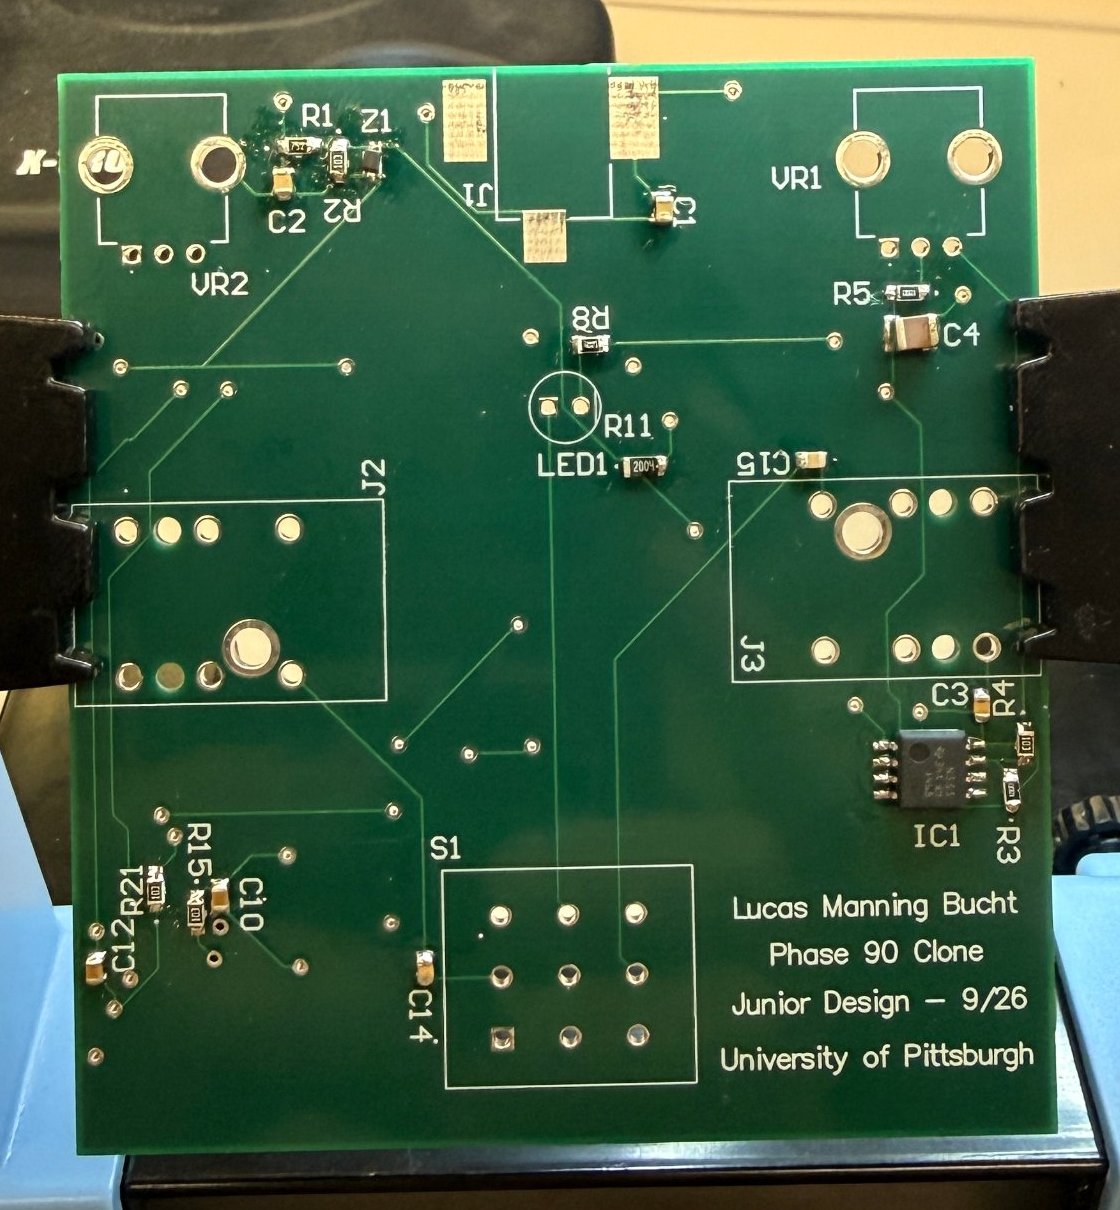
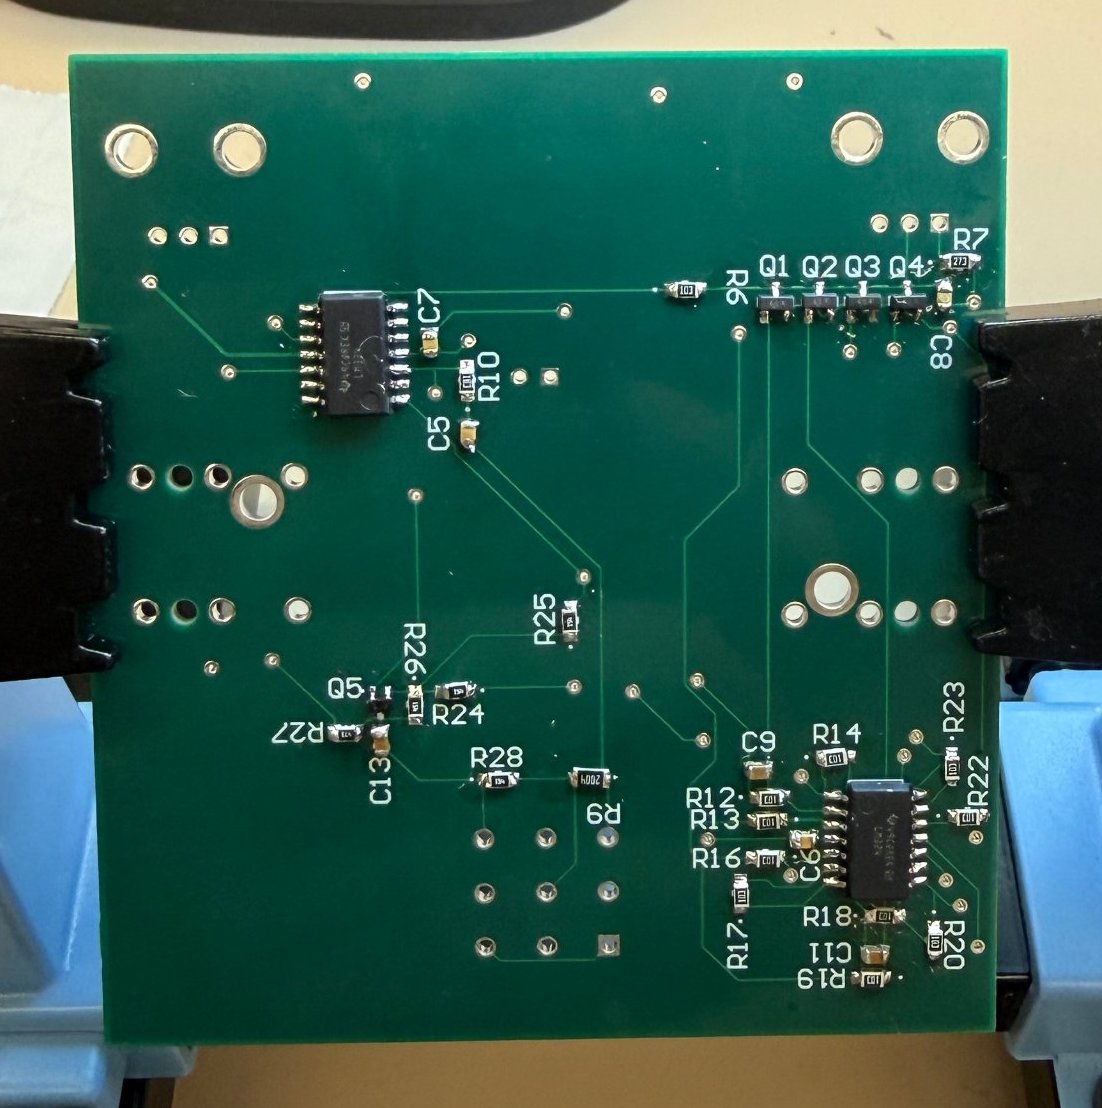
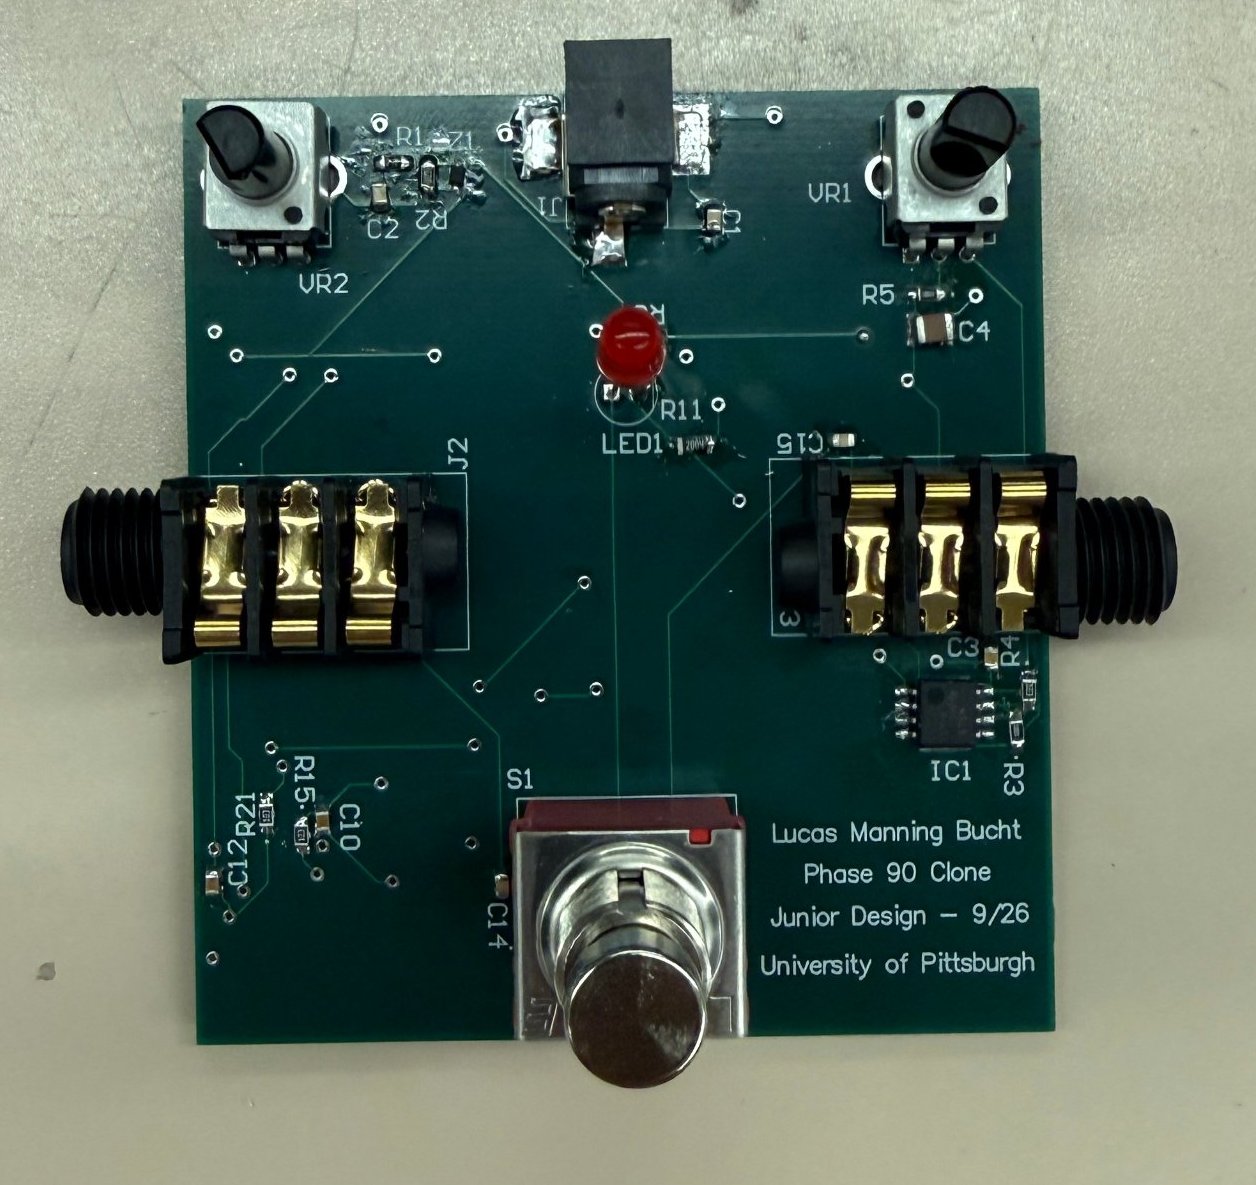
I made three changes to the assembled board during testing, each covered in Design Testing. I replaced C1 and C2 with 25 V capacitors, replaced R24 and R25 with 35 kΩ resistors, and cut the trace to IC3 pin 8.
Design Testing
My test plan was to power the board, confirm the LFO, and then check the audio path with a test tone and a guitar. I used a Rigol DS1102E oscilloscope and a function generator for the bench measurements.
On first power-up, the pedal had three problems: heavy noise, a hard on/off volume chop instead of a phase sweep, and an LED that did not work. I worked through them one at a time.
Supply Noise
A TA pointed out that C1 and C2 were 6.3 V capacitors sitting on the 9 V rail. Running a capacitor above its rated voltage risks failure, and Class II ceramics like these X5R parts lose much of their capacitance under DC bias even within their rating. In practice, the bulk filtering on the rail was a fraction of the 47 µF I designed for. Replacing both with 25 V parts of the same value cut the noise down substantially.
LED Buffer Pin Error
The LED driver was meant to be a unity-gain follower on IC3’s third section: LED_Amp into the non-inverting input (pin 10), with the output (pin 8) tied to the inverting input (pin 9) and driving R8. The board was routed from an earlier version of the schematic that had these pins swapped. LED_Amp connected to pin 8 alone, and pins 9 and 10 were tied together and ran through R8 to the LED.
With both inputs tied together, that section behaved like a comparator with zero differential input, and its output sat at 0 V. LED_Amp is the same net as the LFO buffer’s output (pin 14), so this put two op-amp outputs on one node. The LED section tried to hold the LFO line at 0 V while the LFO buffer tried to drive it.
Cutting the trace to pin 8 removed the conflict, and the rest of the circuit worked normally. It also left nothing driving the LED, so the LED does not function on the final board. Fig. 4 shows the corrected schematic.
Tremolo Instead of Phasing
The pedal also chopped the volume on and off at the LFO rate instead of sweeping. The LFO output was a clean triangle that tracked the speed knob (Fig. 31), so the LFO was not the cause.
The cause was the bias on the mixer. With R24 and R25 at 150 kΩ, the values from the reference design, Q5 was not biased correctly, and instead of adding the dry and wet signals, the stage effectively subtracted them.
That explains the chop. When the LFO turns the JFETs on, fc moves far above the guitar’s range. By (5), every stage then sits near 180°, and the wet path comes back around to 720°, in phase with the dry path. A mixer that subtracts cancels the signal at exactly those moments. Because rDS changes by orders of magnitude over a small part of the gate swing, the dropout comes on fast, so it sounded like a hard chop instead of a gradual swell.
Replacing R24 and R25 with 35 kΩ resistors fixed the bias. The pedal now sums the two paths and phases as intended.
Final Results
Fig. 29 and Fig. 30 show a 1 kHz sine test tone on CH1 (yellow, 100 mV/div) and the pedal output on CH2 (blue, 20 mV/div) at two points in the LFO cycle. In both captures, the output is shifted well away from the input, and the phase offset between them differs from one capture to the other as the LFO sweeps the all-pass stages. The output trace still carries visible noise at 20 mV/div.
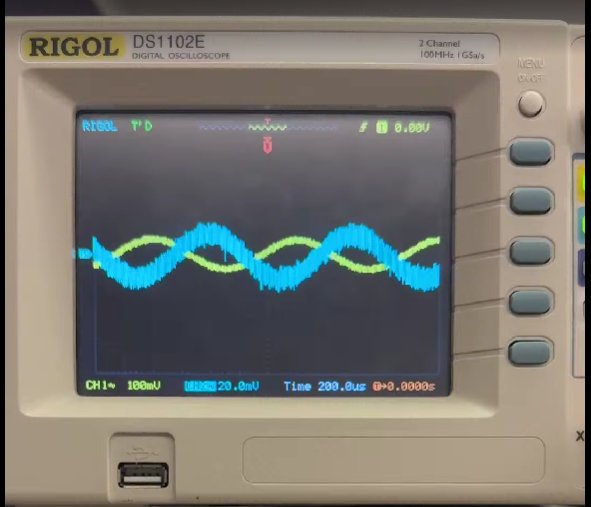
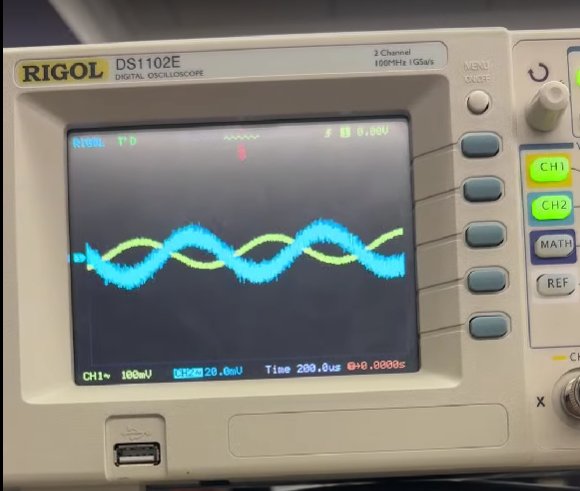
Fig. 31 and Fig. 32 show LFO_Out in roll mode at 500 ms/div. In Fig. 31, the speed knob sits at a middle setting, and the LFO is a clean triangle at about 2.8 Hz and 2.08 Vpp. In Fig. 32, I turned the knob down to its slowest setting partway through the capture. The slow section repeats about every 1.4 s, or roughly 0.7 Hz, close to the 0.65 Hz minimum from (1).
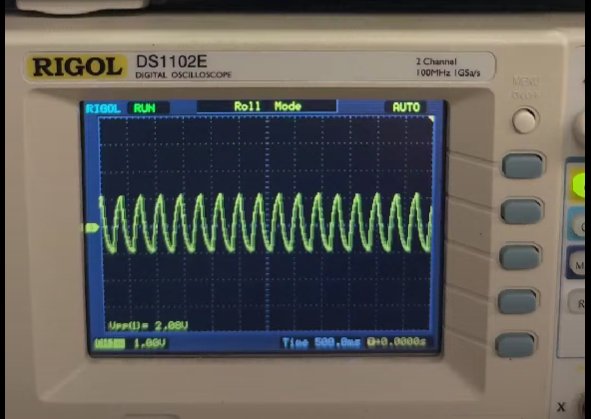
LFO_Out in roll mode at a middle speed setting, 1 V/div and 500 ms/div, AC-coupled.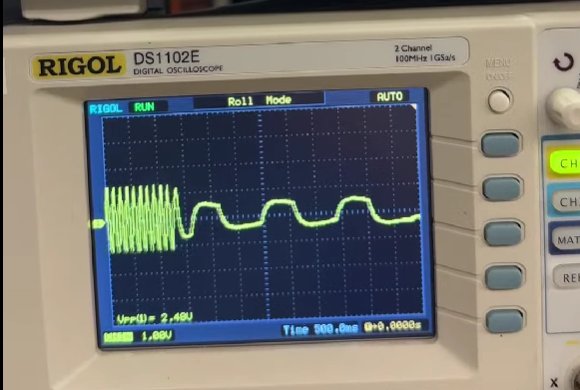
LFO_Out with the speed knob turned to its slowest setting partway through the capture.The slow cycles look flattened and smaller because the channel was AC-coupled. The coupling capacitor’s high-pass corner differentiates a sub-hertz triangle into a rounded square. The trace sitting centered on the channel’s ground marker, instead of at its 2 V to 4 V DC level, is consistent with that. For the same reason, the 2.08 Vpp reading is a lower bound on the true swing, which (3) puts between 2.19 Vpp and 2.94 Vpp depending on VR2.
Here’s the finished pedal in action:
Reflections and Lessons Learned
This project took me through the full design process: simulation, breadboarding, PCB layout, assembly, and debugging a board that did not work the first time. The most useful simulation result was the gate drive problem. Seeing VGS stuck between −3.4 V and −1.6 V in LTspice told me the JFETs would never sweep, and fixing that in simulation was far cheaper than fixing it on a board.
The three hardware faults each taught me something different. The 6.3 V capacitors had the right value, so they passed every check I made. From now on, I will check every part’s voltage rating against the rail it sits on, not just its value.
The LED error showed me that a layout-versus-schematic check only confirms the layout matches the schematic, not that the schematic is right. The LM324’s sections do not share a pin order: sections 2 and 4 count up as IN+, IN−, OUT, while sections 1 and 3 count up as OUT, IN−, IN+ [4]. Assuming section 3 followed section 2’s order puts IN+ on pin 8, which matches the error on my board. Next time, I will check every pin of a multi-section IC against the datasheet before layout.
Finally, the mixer showed me that values copied from a reference design do not always carry over once I change the parts around them.
For a second revision, I would make five changes. First, I would route the LED driver from the corrected schematic. On the current board, a jumper from the LED_Amp net to the pin 9 and 10 net should let IC3’s fourth section drive the LED through R8 directly. Second, I would put 25 V capacitors in the BOM for C1 and C2. Third, I would add a 47 µF capacitor on VRef, as in the reference design and my simulation. Fourth, I would use a 50 kΩ pot for VR2, so the useful bias range spans its whole rotation instead of the first part of it. Fifth, I would change R24 and R25 to 35 kΩ in the schematic to match the fix on the board.
References
- Barbarach, “Breadboard a Simple Phaser,” Barbarach BC. barbarach.com/breadboard-a-simple-phaser
- ElectroSmash, “MXR Phase 90 Analysis.” electrosmash.com/mxr-phase90
- Texas Instruments, “NE555, SA555, SE555 Precision Timers,” datasheet. ti.com
- Texas Instruments, “LM324 Quadruple Operational Amplifier,” datasheet. ti.com
- onsemi, “J111, J112, J113, MMBFJ111, MMBFJ112, MMBFJ113 N-Channel JFET Switch,” datasheet.
- Analog Devices, “LTspice.” analog.com